
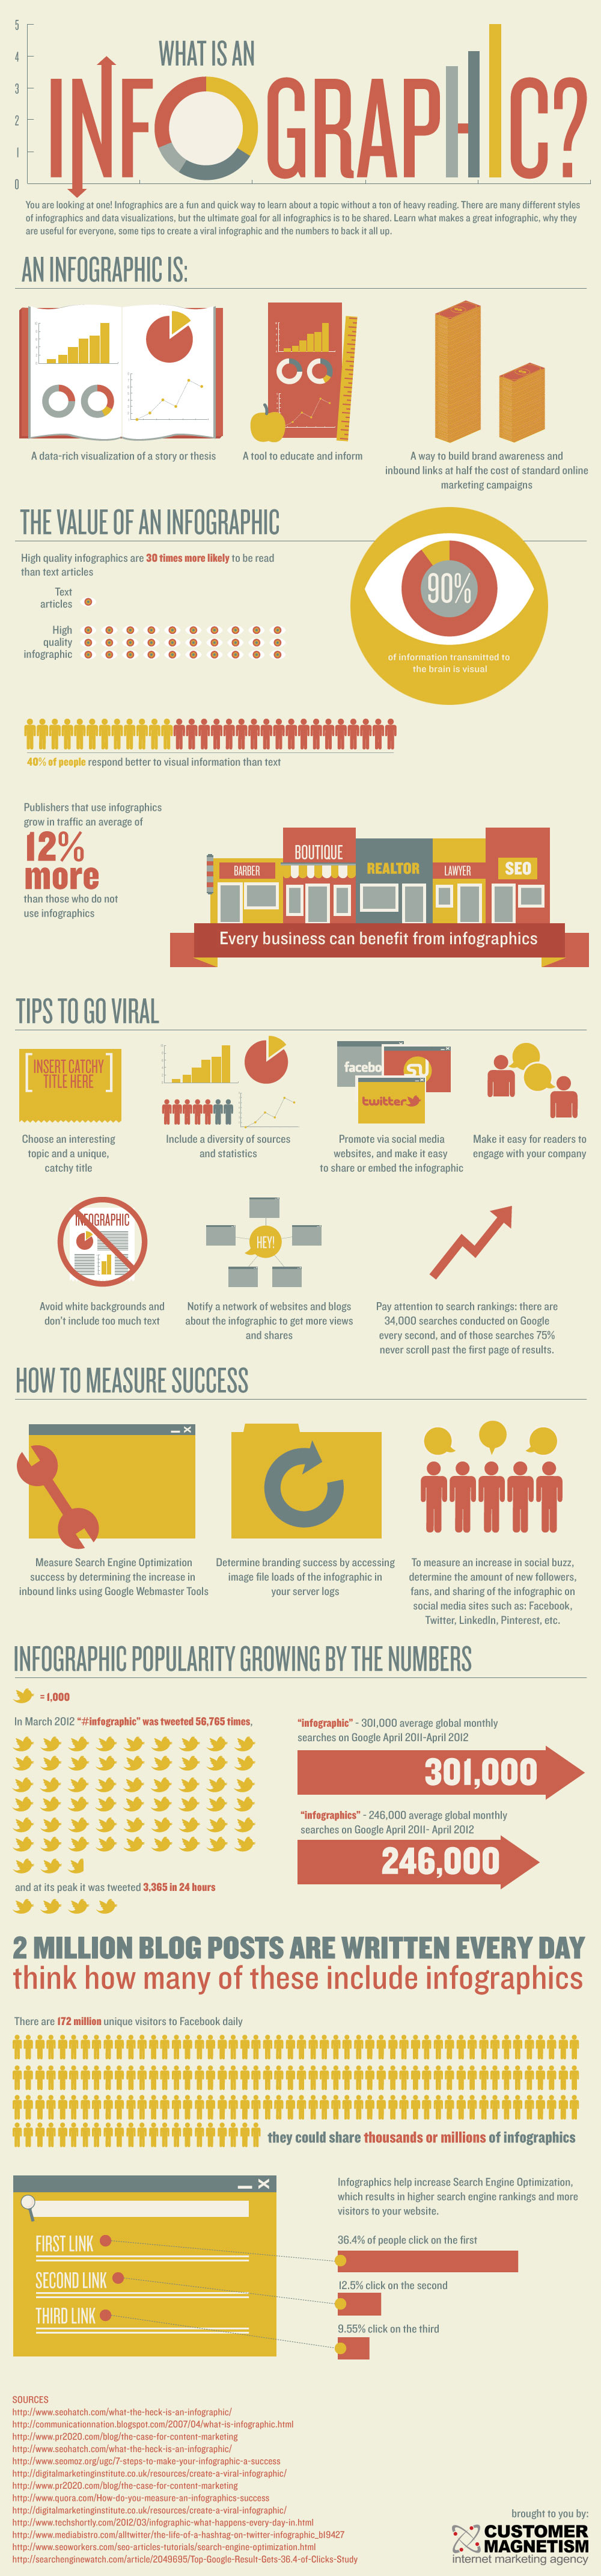
"A visual image such as a chart or diagram used to represent information or data in an easily understandable form."
Created by Hot Butter Studio and shared via the following site: http://visual.ly/what-infographic-2

by Customer Magnetism. Please note the sources are provided at the end.
Created by Customer Magnetism.
How to use this guide
This guide was created to provide you with some information and support around the process of creating an infographic. Tips, recommendations, and links to various visualization tools and resources are provided.
You can work through this guide using the navigation tabs across the top, or you can jump into the specific topic of your choosing.
David McCandless, a Data Journalist, provides an informative and entertaining explanation on how infographics (data visualization) can help make sense of data.
McCandless, D. (2010). The beauty of data visualization [TED talk]. Retrieved from
https://www.ted.com/talks/david_mccandless_the_beauty_of_data_visualization
This LibGuide is based on the format and content of the Infographics LibGuide created by Royal Roads University Library. The content has been modified to meet the needs of the students at St. Paul's.